Go To <<Part 1
Creating the Bubble Chart
Step 3: Add the following namespace declarations
to the XAML Window:

Creating the Bubble Chart
Tools Used:
- Visual Studio 2010 (2008 should work too).
- WPF Toolkit (dll and source - download at www.codeplex.com).
- C#
Step 1: Create a New Visual Studio Project with any name;
I’ll call mine ‘CustomBubble’.
Step 2: Add a reference to the “System.Windows.Controls.DataVisualisation.Toolkit.dll”
file.
Right-Click on the ‘References’ node under project name in
solutions explorer and select ‘Add Reference…’ Navigate to the WPF Toolkit
install folder and select the appropriate .dll package.
xmlns:chartingToolkit="clr-namespace:System.Windows.Controls.DataVisualization.Charting;assembly=System.Windows.Controls.DataVisualization.Toolkit"
xmlns:chartingprimitives="clr-namespace:System.Windows.Controls.DataVisualization.Charting.Primitives;assembly=System.Windows.Controls.DataVisualization.Toolkit"
xmlns:datavis="clr-namespace:System.Windows.Controls.DataVisualization;assembly=System.Windows.Controls.DataVisualization.Toolkit"
Step 4: Add an instance of the main chart area and the
bubble series within the <Grid></Grid> tag. See Code below:
<chartingToolkit:Chart Name="chartSample" Background="Silver" BorderBrush="Black" BorderThickness="3">
<chartingToolkit:Chart.Series>
<chartingToolkit:BubbleSeries Name="bubbleSeries"
/>
</chartingToolkit:Chart.Series>
</chartingToolkit:Chart>
Step 5: Next we’ll specify some static data to be
plotted. See code below. You can add this in the code-behind or create a new
class file for it.
public class TestData: ObservableCollection<TestDataItem>
{
public TestData()
{
Add(new TestDataItem()
{
Label = "North America",
Total = 10,
X = 6,
Y = 3,
Breakdown = new Breakdown()
{
new BreakDownItem()
{ Label = "Hats", Value = 3 },
new BreakDownItem()
{ Label = "Shoes", Value = 5 },
new BreakDownItem()
{ Label = "Bags", Value = 2 }
}
});
Add(new TestDataItem()
{
Label = "South America",
Total = 5,
X = 9,
Y = 4,
Breakdown = new Breakdown()
{
new BreakDownItem()
{ Label = "Hats", Value = 1 },
new BreakDownItem()
{ Label = "Shoes", Value = 1 },
new BreakDownItem()
{ Label = "Bags", Value = 1 }
}
});
Add(new TestDataItem()
{
Label = "Europe",
Total = 7,
X = 3,
Y = 8,
Breakdown = new Breakdown()
{
new BreakDownItem()
{ Label = "Hats", Value = 3 },
new BreakDownItem()
{ Label = "Shoes", Value = 1 },
new BreakDownItem()
{ Label = "Bags", Value = 3 }
}
});
Add(new TestDataItem()
{
Label = "Australia",
Total = 15,
X = 5,
Y = 6.5,
Breakdown = new Breakdown()
{
new BreakDownItem()
{ Label = "Hats", Value = 2 },
new BreakDownItem()
{ Label = "Shoes", Value = 7 },
new BreakDownItem()
{ Label = "Bags", Value = 6 }
}
});
Add(new TestDataItem()
{
Label = "Africa",
Total = 7,
X = 7.5,
Y = 9,
Breakdown = new Breakdown()
{
new BreakDownItem()
{ Label = "Hats", Value = 1 },
new BreakDownItem()
{ Label = "Shoes", Value = 1 },
new BreakDownItem()
{ Label = "Bags", Value = 0 }
}
});
}
}
public class TestDataItem
{
public string Label {
get; set; }
public double Total {
get; set; }
public double X { get; set; }
public double Y { get; set; }
public Breakdown
Breakdown { get; set;
}
}
public class Breakdown: ObservableCollection<BreakDownItem>
{
}
public class BreakDownItem
{
public string Label {
get; set; }
public double Value {
get; set; }
}
Step 6: Now we have defined the data to be plotted,
we need to set it as the ItemSource of the Bubble Series. First we add an
instance of the main class (TestData) to the Resources collection of the
Window:
<Window.Resources>
<local:TestData x:Key="data" />
</Window.Resources>
Then add relevant properties to the Bubble Series
to point it to the data.
<chartingToolkit:BubbleSeries Name="bubbleSeries" Title="Bubble" DependentValuePath="Y" IndependentValuePath="X" SizeValuePath="Total"
ItemsSource="{StaticResource data}" />
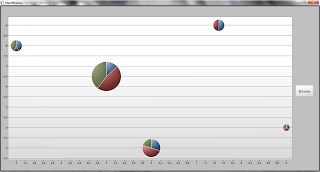
Voila! You can run the application to see what your
bubble series looks like.
The ‘X’ and ‘Y’ values determine the 2D location
of the bubbles while the ‘Total’ value determines the size of the bubble.
Yes, it was actually
that easy.
The next thing now is to change the blue bubbles that
you see to display the data in ‘Breakdown’ class as sectors in each of the
bubbles. See example below:

Go To Part 3>>
I've error: The tag 'TestData' does not exist in XML namespace 'CustomBubble'. I add in my MainWindow.xaml file this line: xmlns:local="clr-namespace:CustomBubble" . But this don't work...
ReplyDeleteWhat namespace does the TestData class belong to?
ReplyDeleteYou may need to replace the string 'CustomBubble' in xmlns:local="clr-namespace:CustomBubble" with your own namespace.
E.g. xmlns:local="clr-namespace:MyNamespace".
...
You can determine your class' namespace by checking the declaration above the class name.
E.g.
namespace MyNamespace
{
public class TestData
{
...
Everything was good, thanks for help, I only have to rebuild my project and then it start works. Is it possible to dynamic change bubble position ? I want to use this for visualization algorithm and values of X and Y changes during the execution of the algorithm.
ReplyDeleteHi Grzegorz. It's good to know you got it working. I suspected that a rebuild could have been the problem too (I just assumed that you would have tried that).
ReplyDeleteWell, in order to change the bubble position at runtime, there are two paths I suggest:
1. Raise property change notification on your X and Y properties (and infact for any property whose updates you would wish to inform the UI about). One popular way to do this is to implement the INotifyPropertyChanged interface. See http://www.codeproject.com/Articles/41817/Implementing-INotifyPropertyChanged.
In the case of our example above, you would want to implement the interface in the TestDataItem class. This should cause the bubble to change location as soon as you set the X or Y property on any of the objects bound to the BubbleSeries' ItemsSource.
2. If the first option doesn't work, then you should try calling bubbleSeries.Refresh() every time you change the X or Y. But I strongly advice you implement the first as a more scalable approach.
Hi, I modified TestDataItem class now it looks like:
ReplyDeletepublic class TestDataItem : INotifyPropertyChanged
{
public string Label { get; set; }
public double Total { get; set; }
private double x;
public double X
{
get;
set
{
x = value;
OnPropertyChanged(new PropertyChangedEventArgs("X"));
}
}
private double y;
public double Y
{
get;
set
{
y = value;
OnPropertyChanged(new PropertyChangedEventArgs("Y"));
}
}
public Breakdown Breakdown { get; set; }
public event PropertyChangedEventHandler PropertyChanged;
public void OnPropertyChanged(PropertyChangedEventArgs e)
{
if (PropertyChanged != null)
{
PropertyChanged(this, e);
}
}
}
My algorithm class:
public class Algorithm
{
public void Execute()
{
...
...
while(i < maxIteration)
{
Move() // this method change values X and Y of data point of element in List<>
i++;
}
}
}
Class algorithm has List of points and properties Result which return this list. I want to update location of points in every iteration. My algorithm is executed by click button. But how to notify Chart that values of X and Y changed ?
You need to set the getter of the X and Y Properties to return the value in the underlying field. Eg. Do this "get { return x; }" instead of "get;"
ReplyDeleteDoing this will ensure that when property change notification is triggered, the UI will retrieve the new value that was set to the field x.
Then ensure that the List which contains the items you are modifying is the one set as the itemssource of the BubbleSeries.
Let me know how it goes.